


The 2012 United States presidential election was the culmination of an 18-month-long campaign that saw voters bombarded with debates, ads, endorsements, and relentless media coverage. There were also dozens of factors for voters to consider when deciding which candidate to cast their ballot for, from stances on policy to questions of character and everything in between.
Given all of this, it would be extremely difficult to predict who any particular segment of the voting public will choose. Yet Nate Silver, a baseball statistician turned political analyst, achieved unprecedented success by correctly predicting how all 50 states would vote.
Silver had access to the same polls as other analysts, yet the remarkable accuracy of his predictions suggests he (and his mathematical model) saw patterns in the data that nobody else did.
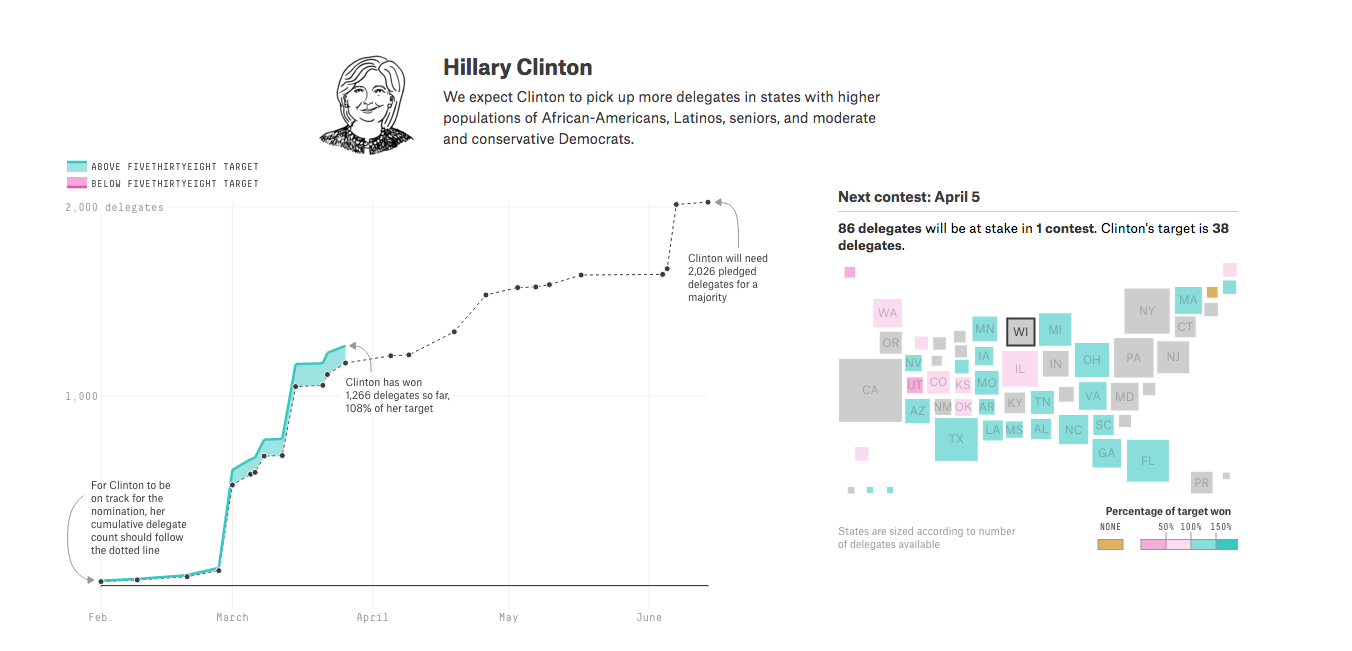
Silver’swebsite, FiveThirtyEight, named for the number of votes in the Electoral College, has been forecasting the results of Republican and Democratic presidential primaries, ever since primaries began in February. His predictions are based on three main factors: State polls, national polls, and endorsements.
Silver’s simplest model, described as “polls-only,” does more than simply average the results of the most recent state polls: Larger polls count for more than smaller ones, and each polling company is assigned a reliability rating based on the accuracy of their past polls, which determines how much weight that company’s polls are given.
His “polls-plus” model also takes into account how candidates are faring in national polls, as well as the number of endorsements that they have received from sitting members of the House of Representatives, from senators, and from state governors.
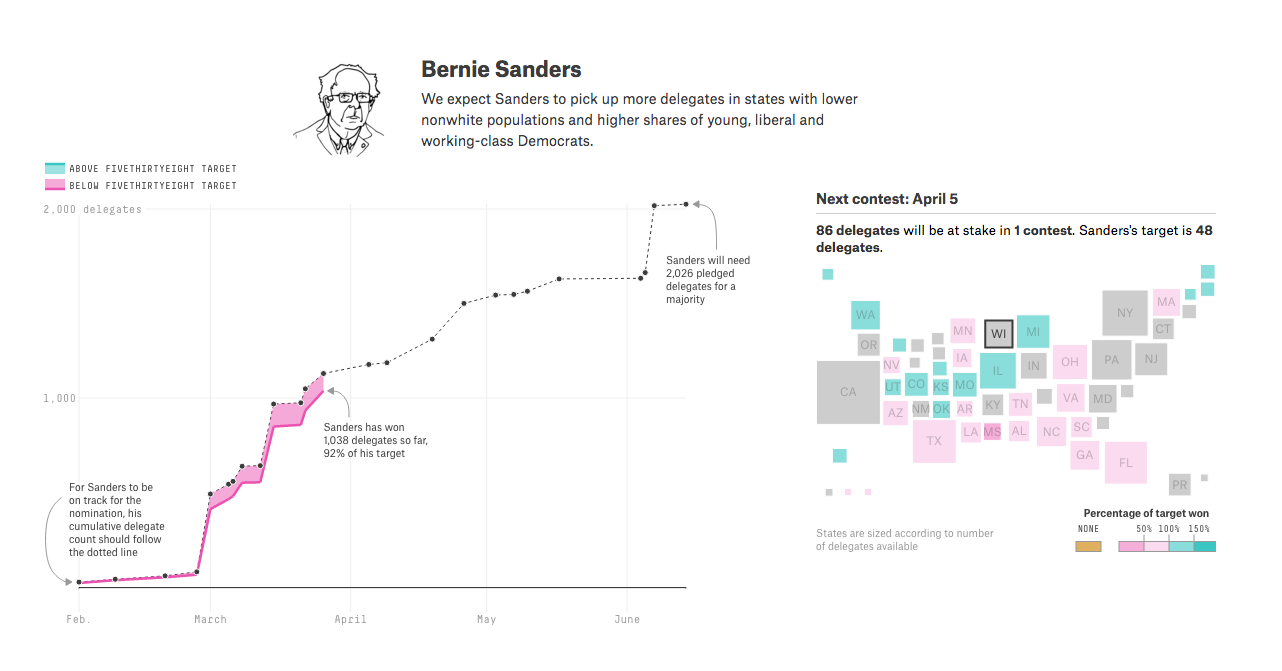
Of course, even the most sophisticated models aren’t right in every case, but when models and polls alike miss by spectacular margins, it’s clear that some factors were not accounted for. One such case is in Michigan, where Bernie Sanders won the Democratic primary over Hillary Clinton despite being given a less than one per cent chance at victory by Silver’s models.
Major news networks remained confused even after votes began to pour in, with the Associated Press waiting until 11:30 PM to call Michigan for Sanders. One large election returns provider, Decision Desk HQ, even called Michigan for Clinton earlier in the evening, despite the fact that she was trailing by more than five per cent.
The election night hesitations were largely due to the fact that Wayne County, which contains Detroit and a relatively large percentage of non-white voters, a demographic that has favoured Clinton, was among the last to finish reporting its votes. Clinton ended up winning Wayne County by over 20 percentage points, and the statewide non-white vote by 29 points, but this was not enough to overcome the lead that Sanders had built in rural areas with a higher percentage of white voters.
The day after the primary, Carl Bialik of FiveThirtyEight, discussed in an article just what had gone wrong with the polls. The main factor was that polls had mistakenly estimated the demographic of the electorate. Voters under 30 made up a much larger percentage than expected and Sanders won over 80 percent of their votes. Another consideration was the surprisingly large number of voters who self-identified as independents. There were twice as many as expected, and Sanders won their vote by 43 percentage points.
The message, after all of the dust had cleared was that elections, much like weather, are complicated and chaotic systems. These systems are incredibly difficult to predict, and mistakes come with the territory, but the more that statistics are used to analyze them, the greater our understanding of them grows.